38+ Cart Abandonment Rate Statistics (2026 Updated)

Shopping cart abandonment is frustrating. What makes the feeling worse is not knowing how your cart abandonment rate compares with others’. Is it normal? Or is it below industry standards?
We’ve calculated the average cart abandonment rate based on the most relevant and recent studies. So we can confidently say that:
The average documented online shopping cart abandonment rate is 74.8%.
But our overview doesn’t end here. We have gathered lots of relevant cart abandonment stats to help you benchmark your rates against industry standards.
Most recent cart abandonment rate statistics
71.72% Uptain, 2025 (retrieved September 2025)
75.45% XP2, 2025 (retrieved July 2025)
72.5% Vibetrace 2024 (retrieved July 2025)
79.53% SalesCycle 2023 (retrieved June 2025)
Why we made this abandoned cart statistics overview
We made this overview because we needed an up-to-date benchmark for abandoned cart statistics ourselves. For our work in email marketing campaigns, ecommerce reviews, and research articles.
There are lots of articles online, but most aren’t usable. Lots of fluff, outdated stats, or questionable research.
So we rolled up our sleeves and did a deep dive into everything abandoned cart and gathered all the relevant abandoned cart statistics. It’s structured to be easy to understand and use.
So what is the definitive number? By calculating the average of all top findings, we found out that the rate of abandoned carts is 74.8%.
If you’re looking for up-to-date cart abandonment statistics, look no further than our overview.
Key cart abandonment rate statistics
- An average of 74.8% carts get abandoned.
- 68% of direct-to-consumer brands send at least one abandoned cart email.
- The industry with the highest cart abandonment rate is fashion (84.61%), followed by travel (84.56%) and retail (72.23%).
- The lowest abandoned cart rate across sectors is 50.03% for grocery shopping.
- 39% of consumers abandoned their online shopping carts during checkout due to extra costs like shipping charges, taxes, or fees. 21% abandoned their carts because delivery was too slow, while 19% didn’t trust the site with their credit card details.
- Mobile devices have the highest shopping cart abandonment rates at 78.74%. Tablet users are at 70.26%, and desktop users have a cart abandonment rate of 66.74%.
Why do users abandon their online shopping carts?
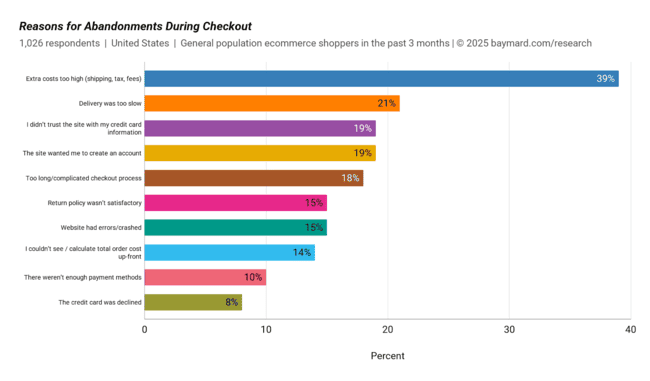
- 39% of consumers abandoned their shopping carts during checkout due to extra costs like shipping costs, taxes, or fees. 21% abandoned their carts because delivery was too slow, while 19% didn’t trust the site with their credit card information.
- In a survey by DHL, 1 in 3 shoppers reported they had abandoned their carts due to sustainability concerns.
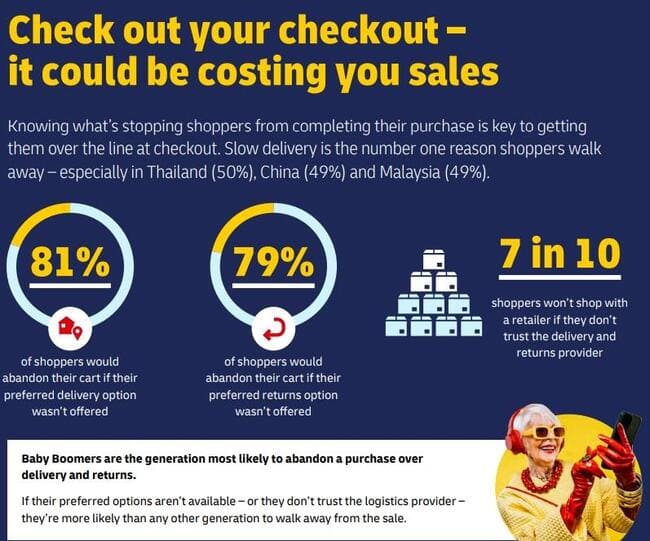
- 81% of shoppers said that they would abandon their carts if their preferred delivery option wasn’t offered. And 79% said they would abandon their shopping carts if their preferred returning option wasn’t offered.
General cart abandonment rate statistics
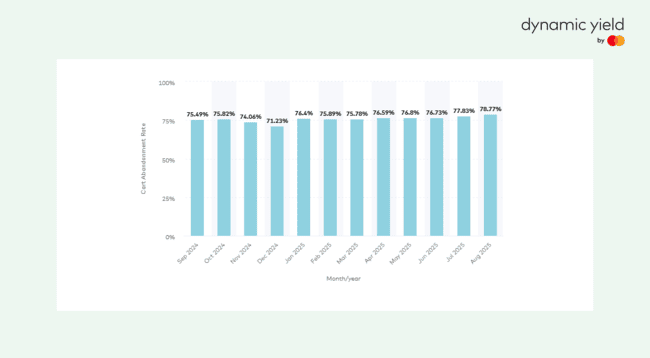
- The average shopping cart abandonment rate worldwide is 78.77% as of August 2025.
- December has the lowest abandonment rate (71.36%) of the year, while August has the highest (78.77%).
- The 25th of the month has the lowest cart abandonment rate (below 79%), while the 23rd has the highest cart abandonment rate (above 80%).
- Sunday has the highest cart abandonment rate, while Monday has the lowest. Online shoppers usually browse on Sunday and convert on Monday.
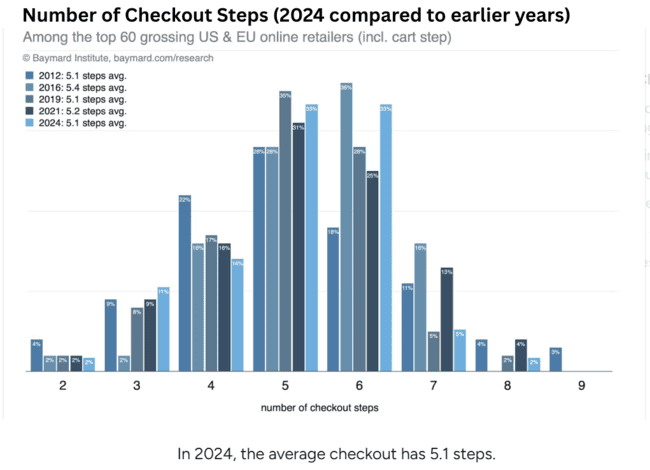
- The average checkout flow has 5.1 steps from shopping cart to the order review. This has remained unchanged since 2012.
Cart abandonment statistics by industry
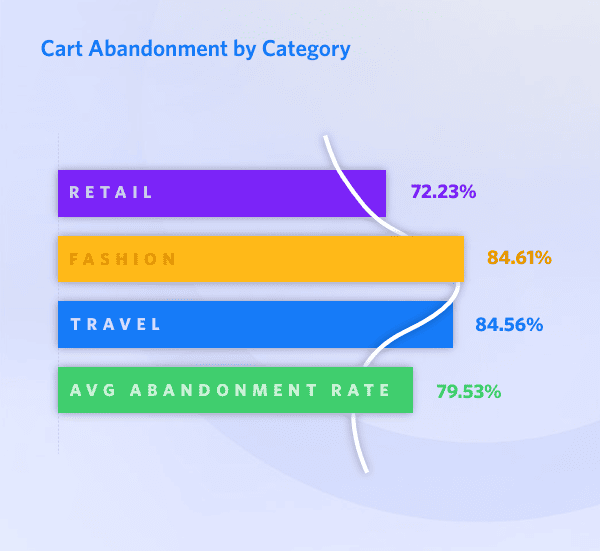
- The retail industry’s cart abandonment rate is 72.23%, fashion’s is 84.61%, and travel’s is 84.56%. The average abandonment rate for all three sectors is 79.53%.
- In another report, luxury and jewelry are mentioned to have the highest abandonment rates at 82.84%, followed closely by beauty and personal care at 80.92%, and home and furniture at 80.32%.
Average shopping cart abandonment rate by region
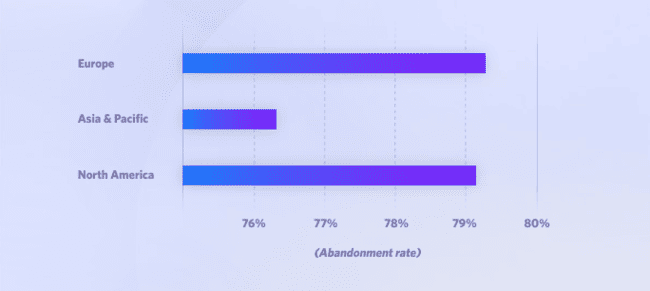
- Asia and the Pacific have a cart abandonment rate of around 76% which is lower than in North America and Europe. This could be due to North America and Europe’s relatively higher shipping costs. And the process of global returns is much more complicated for these markets.
- Brands in the Middle East and Africa experience the highest shopping cart abandonment rate at 93%. This was followed by Asia-Pacific, East Asia, and Latin America (each at 87%).
Average shopping cart abandonment rate by device
- Mobile devices have the highest shopping cart abandonment rate at 78.74%. Tablet users are at 70.26%, and desktop users have a cart abandonment rate of 66.74%.
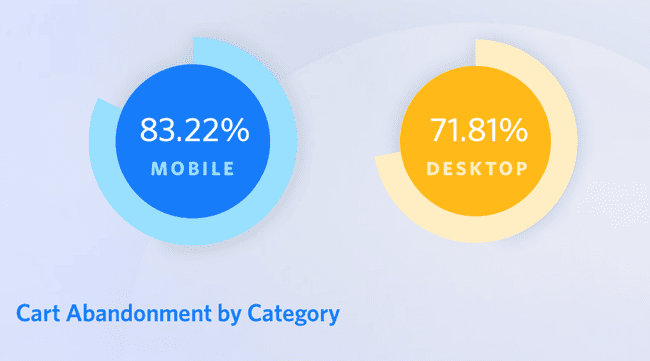
- A report by Salescycle mentions that the cart abandonment rate among mobile users is 83.22%, and for desktop users it’s 71.81%.
Shopping cart abandonment rate by platform
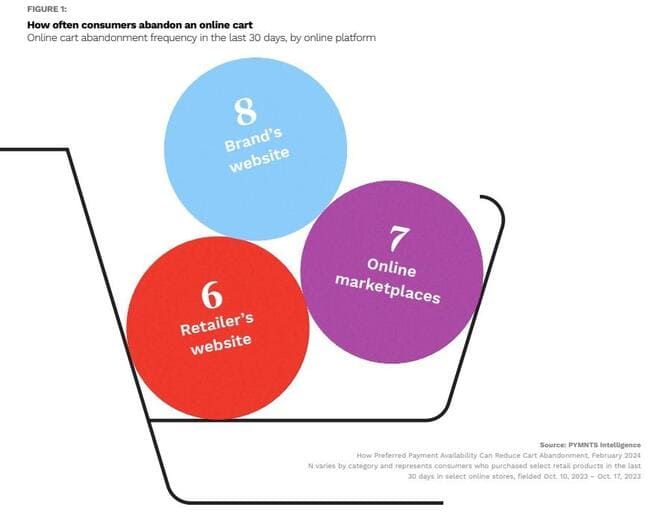
- In a time frame of 30 days, shoppers abandoned their carts mostly on brand websites (8 times), followed by online marketplaces (7 times) and retailer websites (6 times).
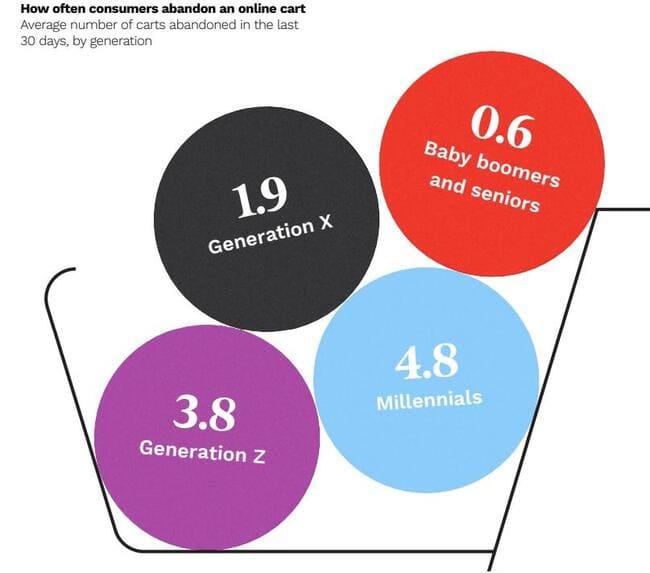
Shopping cart abandonment rate by consumer age
- Millennials are reported to have the highest average number of carts abandoned at 4.8 carts in 30 days. They are followed by Generation Z with 3.8 carts, Generation X with 1.9 carts, and Baby Boomers and Seniors with just 0.6 abandoned carts in 30 days.
Abandoned cart email stats
- Of 1,000 direct-to-consumer brands, 68% triggered an abandoned cart email, and 1,233 emails were sent to retrieve abandoned carts.
- 85% of travel accessory retailers send cart abandonment emails, followed by jewelry (77%) and apparel (75%).
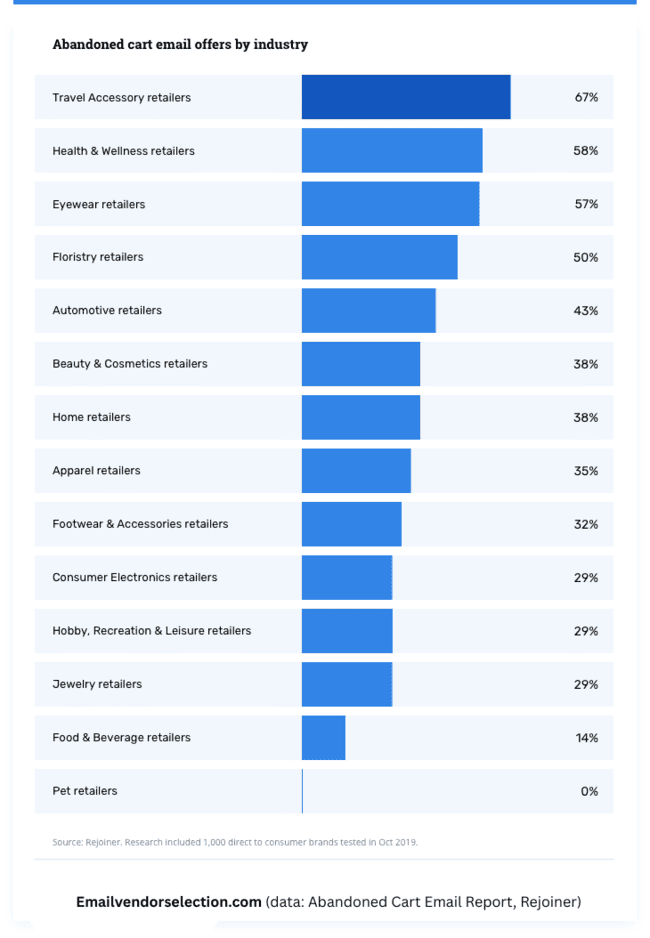
- 67% of travel accessory retailers include offers in their cart abandonment emails. They are followed by health and wellness retailers (58%) and eyewear retailers (57%). None of the pet retailers include offers in their cart abandonment emails.
- 21% of consumer brands sent two cart abandonment emails, 16% sent three, 7% sent four, and 2% sent five or more.
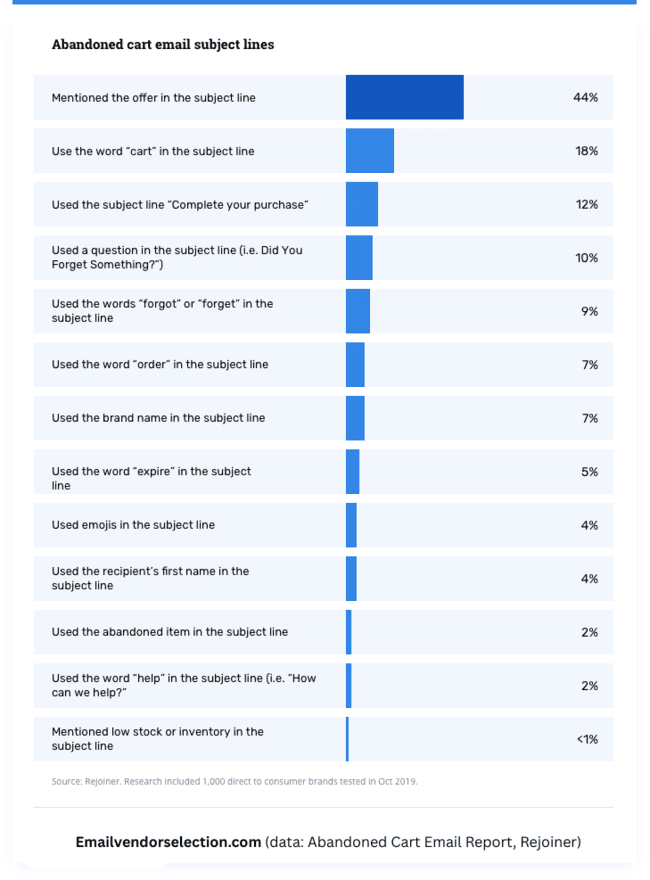
- Among the abandoned cart emails sent, 44% mentioned an offer in their subject lines. 18% used the word “cart,” and 12% used “complete your purchase.”
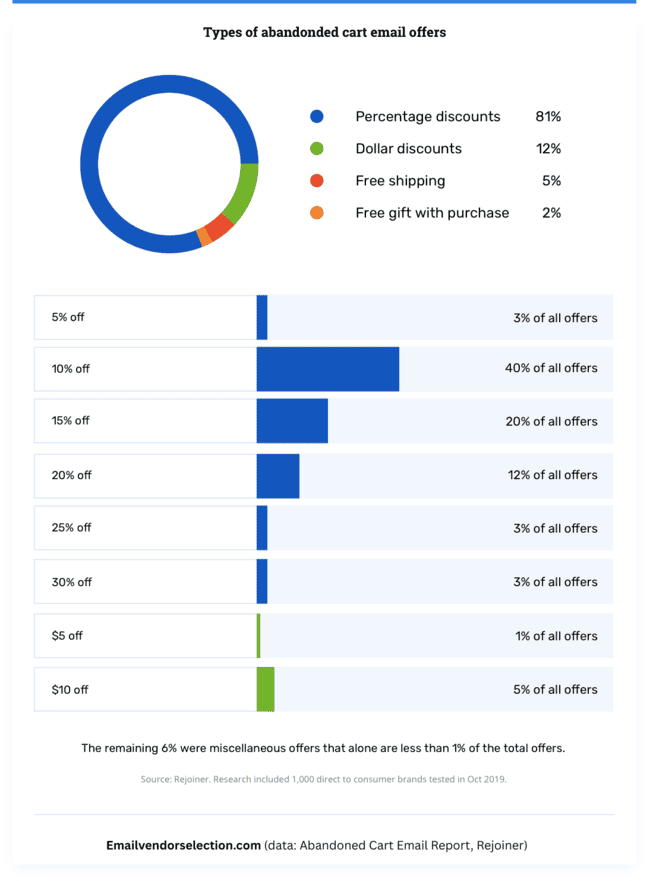
- 81% of the abandoned cart emails offered percentage discounts, 12% offered dollar discounts, and 5% offered free shipping.
- 40% of cart abandonment emails with discounts offered 10% off, 20% offered 15% off, and 12% offered 20% off.
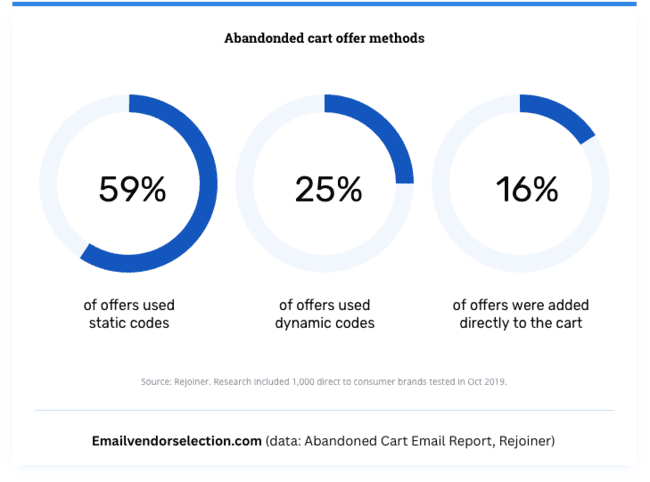
- 59% of cart abandonment emails with offers used static codes (ex. “mydiscount15”), 25% used dynamic codes (a random string of characters), and 16% were added directly to the cart.
- 50% of brands with a cart abandonment email series sent their first offer in the first email. 30% sent it in the second email, and 18% sent it in the third email.
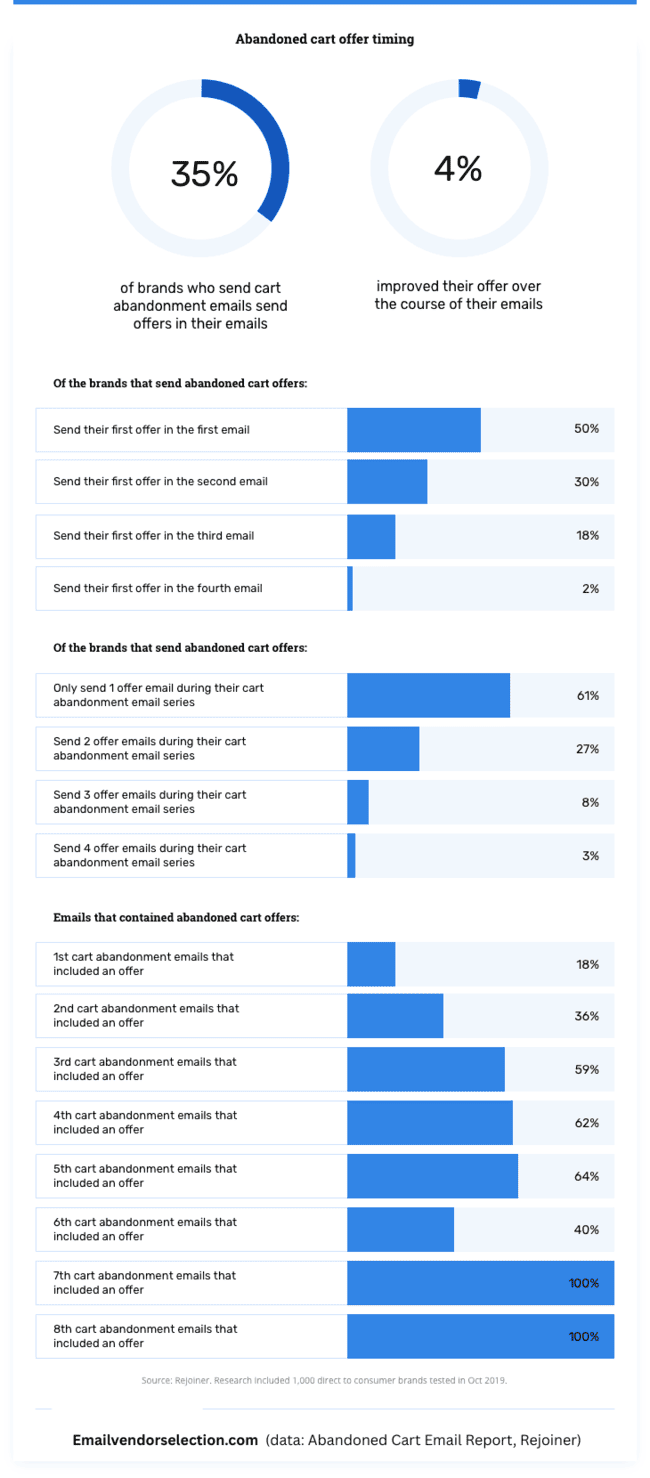
- 61% of brands only sent one offer email during their cart abandonment email series, 27% sent two offer emails, and 8% sent three offer emails.
- 18% of the first cart abandonment emails sent by brands included an offer, 36% of the second emails included an offer, and 59% of the third emails included an offer. 100% of the seventh and eighth abandoned cart emails included an offer.
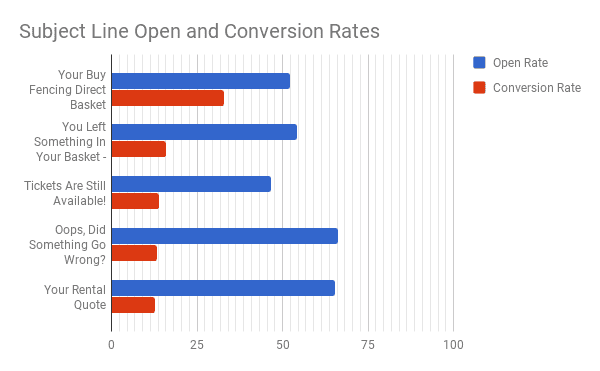
- The cart abandonment email subject lines “Oops, Did Something Go Wrong?” and “Your Rental Quote” have the highest open rates at roughly 70%. The subject line “Your Buy Fencing Direct Basket -” has the highest conversion rate at around 30%.
- Abandoned cart flows deliver the highest average placed order rate at 3.33%. This is the top among all automated email flows.
- Abandoned cart email flows generate $3.65 revenue per recipient (RPR) on average. This is the highest across all other email flow types.
- Food & beverage businesses achieved the strongest abandoned‑cart email results, with an average open rate of 52.16%, click rate of 6.63% and conversion rate of 3.66%.
- Sporting goods followed closely with similarly high metrics: 51.69% open rate, 6.95% click rate, and a 3.50% conversion rate.
- Apparel & accessories matched the all‑industry average click rate (6.25%), but posted slightly higher open (51.43%) and conversion (3.42%) rates.
- Office supplies and specialty businesses saw below‑average open and click rates, yet still delivered above‑average conversion rates of 3.45% and 3.36%, respectively.
5 Best practices to recover cart abandonment lost ROI
Below are some ways ecommerce stores can reduce shopping cart abandonment and increase their sales revenue.
Before applying any of the tips below, make sure to regularly test your emails and checkout pages to determine which variant generates the most opens and clicks. Also, take customer feedback into account to help you identify problems your regular tests can’t detect.
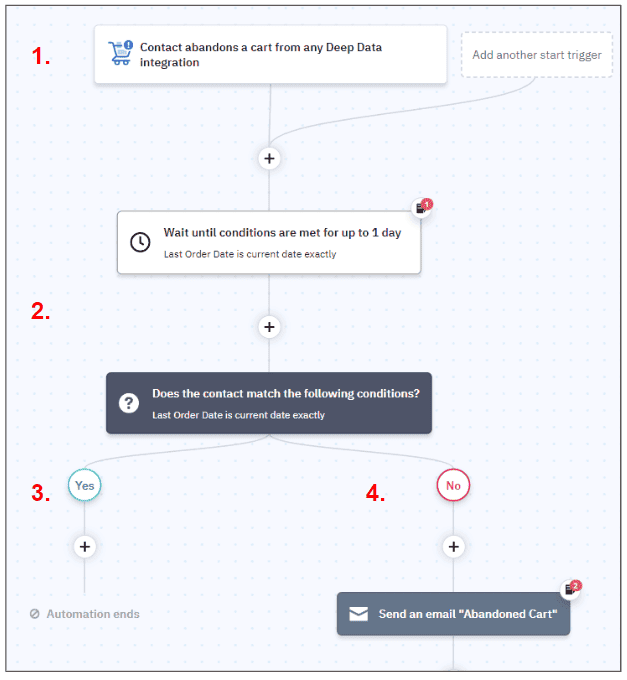
1. Send cart abandonment email workflows
To set up an email workflow for your ecommerce store, you must first choose an ecommerce email marketing platform that supports automation, like Omnisend or Klaviyo. They have handy features for creating automated emails triggered by specific customer actions. Then, set the cart abandonment as the trigger for the cart abandonment email campaigns.
After that, design the emails and create their content. The goal is to gently remind shoppers about the items left in their cart. Use your data about the customer to personalize the emails by including their name and the items in their abandoned shopping carts.
Consider offering incentives like free shipping or a discount code in your follow-up emails. Timing is also essential. Send the first email a few hours after abandonment, with one or two more emails sent over the next few days.
2. Optimize the checkout process and design
A complicated checkout process is one of the top reasons shoppers abandon their carts. Minimize the steps required to complete a purchase in your checkout process to reduce cart abandonment and improve the return on investment (ROI) for your ecommerce site.
Aim for a one-page checkout when possible, and limit the information you demand from the customer to only what is necessary for the transaction.
Using real-time field validation is also a game-changer. It helps customers correct errors like improperly formatted phone numbers or email addresses before they submit the form. This enables them to correct input mistakes on the fly and complete their purchase successfully.
Most ecommerce sites require shoppers to create an account before purchasing. While this allows you to provide better personalization, customer support, and order management, some just want to buy from your site without these bells and whistles. Consider allowing the guest checkout option to reduce barriers to completion.
Also, people need to trust your site before making a purchase. To provide security reassurances, use SSL encryption to reassure customers that their personal and payment information is secure.
3. Run retargeting ads
Place the tracking code from an ad platform (Google Ads or Facebook Ads) on your site to set up a retargeting ad campaign. This code tracks cart abandoners and enables ad platforms to serve them retargeted ads on websites and social media they visit.
You also need to create audience segments based on their behavior. One segment to target could be users who added products to their cart but left the checkout page. Another segment could be those who viewed specific products but did not add anything to their carts.
From here, you’re ready to craft your ads to catch the audience’s attention and encourage them to return. Use images of the products they viewed or added to their cart, and include compelling call-to-actions (CTAs) like “Return to Cart” or “Complete Your Purchase.” Also, consider including discounts or free shipping within the ads to sweeten the deal.
People from your audience segment will see your ads on various websites, and this reminds them of the items they left in their cart or viewed but didn’t buy.
While you want people to clear out their carts by placing orders, the last thing you want is to be annoying with your ads. This will leave a bad mark on people’s minds and would dissuade them from ever returning to your online store. The objective of using retargeting ads is to get these potential customers back to your store to complete their purchase. In this case, adjust the frequency of the ads to avoid overwhelming your potential customers and causing ad fatigue.
4. Offer multiple payment options
Most ecommerce platforms, particularly Shopify and WooCommerce, have their own payment gateways for users in supported countries. They also allow merchants to accept credit cards directly without third-party accounts.
However, if you have a large customer base in specific areas, you must integrate the popular payment methods in those regions (e.g., Alipay in China and Sofort in Germany). By providing a variety of payment methods, you cater to your customers’ diverse preferences.
Integrating third-party payment gateways begins with registering for a merchant account with each payment processor. You then install the necessary plugins or extensions on your platform. Next, you need to set up the payment gateway with your plugin to include critical details such as API keys, secret keys, and other integration credentials.
Make sure to thoroughly test each payment method to ensure that transactions are processed smoothly. And then modify the checkout interface to make sure that the payment gateway is available as an option. You should be able to check transaction flow and user experience issues here and resolve them before making these payment gateways live.
Once the payment gateways are successfully set up, monitor each payment method’s performance. Keep in mind that third-party payment gateways may have monthly fees you need to cover. So, if you’re not making enough through these gateways to cover the costs, consider taking them out of your checkout process.
5. Improve user experience across devices
Good user experience (UX) in ecommerce stores begins with a clear, distraction-free, and mobile-friendly design across all your product pages. Highlight important information like price totals, shipping details, and call-to-action buttons (“Complete Purchase” and “Go to Payment”).
Another positive UX is the use of clear and concise language. Product descriptions, checkout flows, and any instructional content should also be easy to read. This lets you cut through the noise and help shoppers find what they want immediately.
You want your online store to be inclusive by allowing people with disabilities (PWD) to access your site without problems. To do this, install an accessibility widget on your site. These widgets typically assist people with disabilities to access your site more conveniently by adding tooltips, making the font larger, and adjusting its colors.
Simplifying navigation by streamlining your ecommerce site’s structure is another way to improve your ecommerce website’s UX. Ensure that you organize product categories in a clear, hierarchical structure and that the number of clicks required to find products is minimized. Consider using a hamburger menu to save space and maintain clarity.
Finally, a slow website loading time is a major deterrent for online shoppers, especially those using mobile devices. Optimize images, use browser caching, and reduce redirects to improve your page’s loading times.
Cart abandonment stats FAQs
Sources
Why do users abandon their online shopping cart?
1. Baymard Institute, “49 Cart Abandonment Rate Statistics 2025”
2-3. DHL, “2025 E-Commerce Trends Report”
General Cart Abandonment Rate
1-2. XP², “Shopping cart abandonment rate for eCommerce”
3-4. SalesCycle, “Ecommerce Stats and Trends Report”
5. Baymard Institute, “Checkout Optimization: 5 Ways to Minimize Form Fields in Checkout”
Cart Abandonment Statistics by Industry
1. Salescycle, “Ecommerce stats and trends report”
2. XP², “Shopping cart abandonment rate for eCommerce”
Average Shopping Cart Abandonment Rate By Region
1. SalesCycle, “Ecommerce Stats and Trends Report
2. Statista, “Shopping cart abandonment rate by region”
Average Shopping Cart Abandonment Rate By Device
1. XP², “Shopping cart abandonment rate for eCommerce”
2. Salescycle, “Ecommerce stats and trends report”
Average Shopping Cart Abandonment Rate By Platform
1. Pymnts, “How Preferred Payment Availability Can Reduce Cart”
Average Shopping Cart Abandonment Rate By Age
1. Pymnts, “How Preferred Payment Availability Can Reduce Cart”
Abandoned Cart Email Stats
1-11. Rejoiner, “Abandoned Cart Email Statistics & Strategy”
12. Rejoiner, “5 of the Best Abandoned Cart Email Subject Lines”
13-18. Klavyio, “The abandoned cart benchmarks report: 2024 data to inform your strategy“